Understanding Blockchain Latency and Throughput
Jul 11, 2022 | Lefteris Kokoris-Kogias
How to properly measure a (blockchain) system is one of the least talked about but most significant steps in its design and evaluation. There are numerous consensus protocols and variations with various performance and scalability tradeoffs. But as of yet, there is still no universally agreed-upon, reliable method that enables apples-to-apples comparisons. In this blog post, we outline a method inspired by measurements in data-center systems and discuss common errors to avoid when evaluating a blockchain network.
Key metrics and their interaction
Two important metrics should be taken into account when developing a blockchain system: latency and throughput.
The first thing that users are concerned with is transaction latency, or the amount of time between initiating a transaction or payment and receiving confirmation that it is valid (for instance, that they have enough money). In classical BFT systems (e.g. PBFT, Tendermint, Tusk & Narwhal, etc), a transaction is finalized once it gets confirmed, whereas in longest-chain consensus (e.g. Nakamoto Consensus, Solana/Ethereum PoS), a transaction may get included in a block and then reorged. As a result, we need to wait until a transaction is "k-blocks deep," resulting in a latency that is significantly greater than a single confirmation.
Second, the throughput of the system is typically important to system designers. This is the total load that the system handles per unit of time, expressed typically in transactions per second.
At first glance, these two key metrics appear to be the inverse of one another. Because throughput is measured in transactions per second and latency is measured in seconds, we would naturally expect that Throughput = Load / Latency.
This, however, is not the case. This realization is difficult because many systems tend to produce graphs that display either the throughput or the latency on the y-axis with something like the number of nodes on the x-axis. Instead, a better graph to generate is that of a throughput/latency graph, which makes it apparent by not being linear.

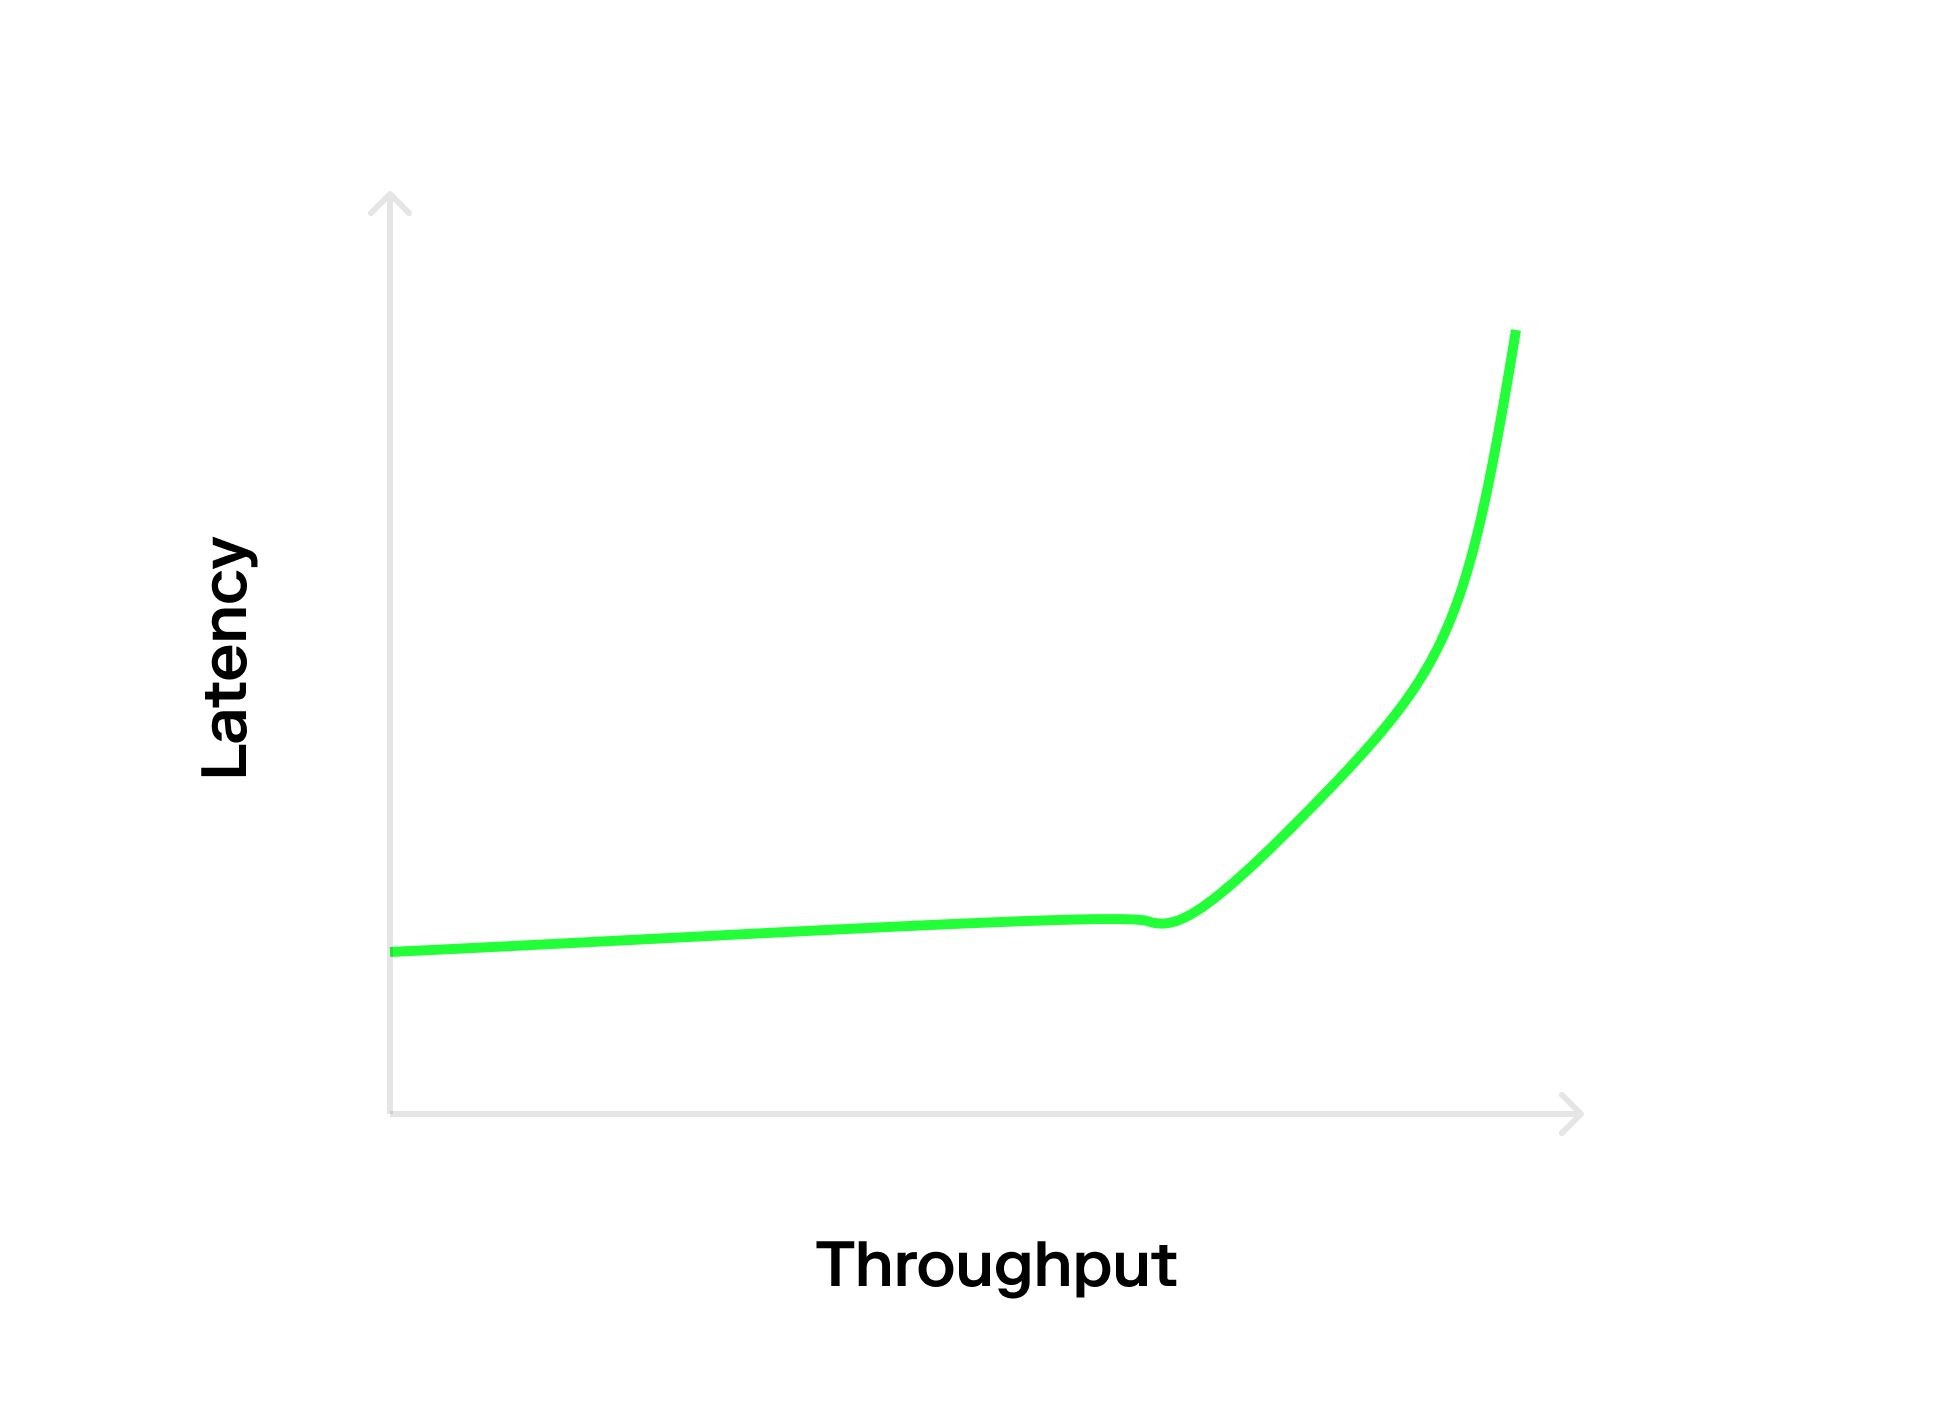
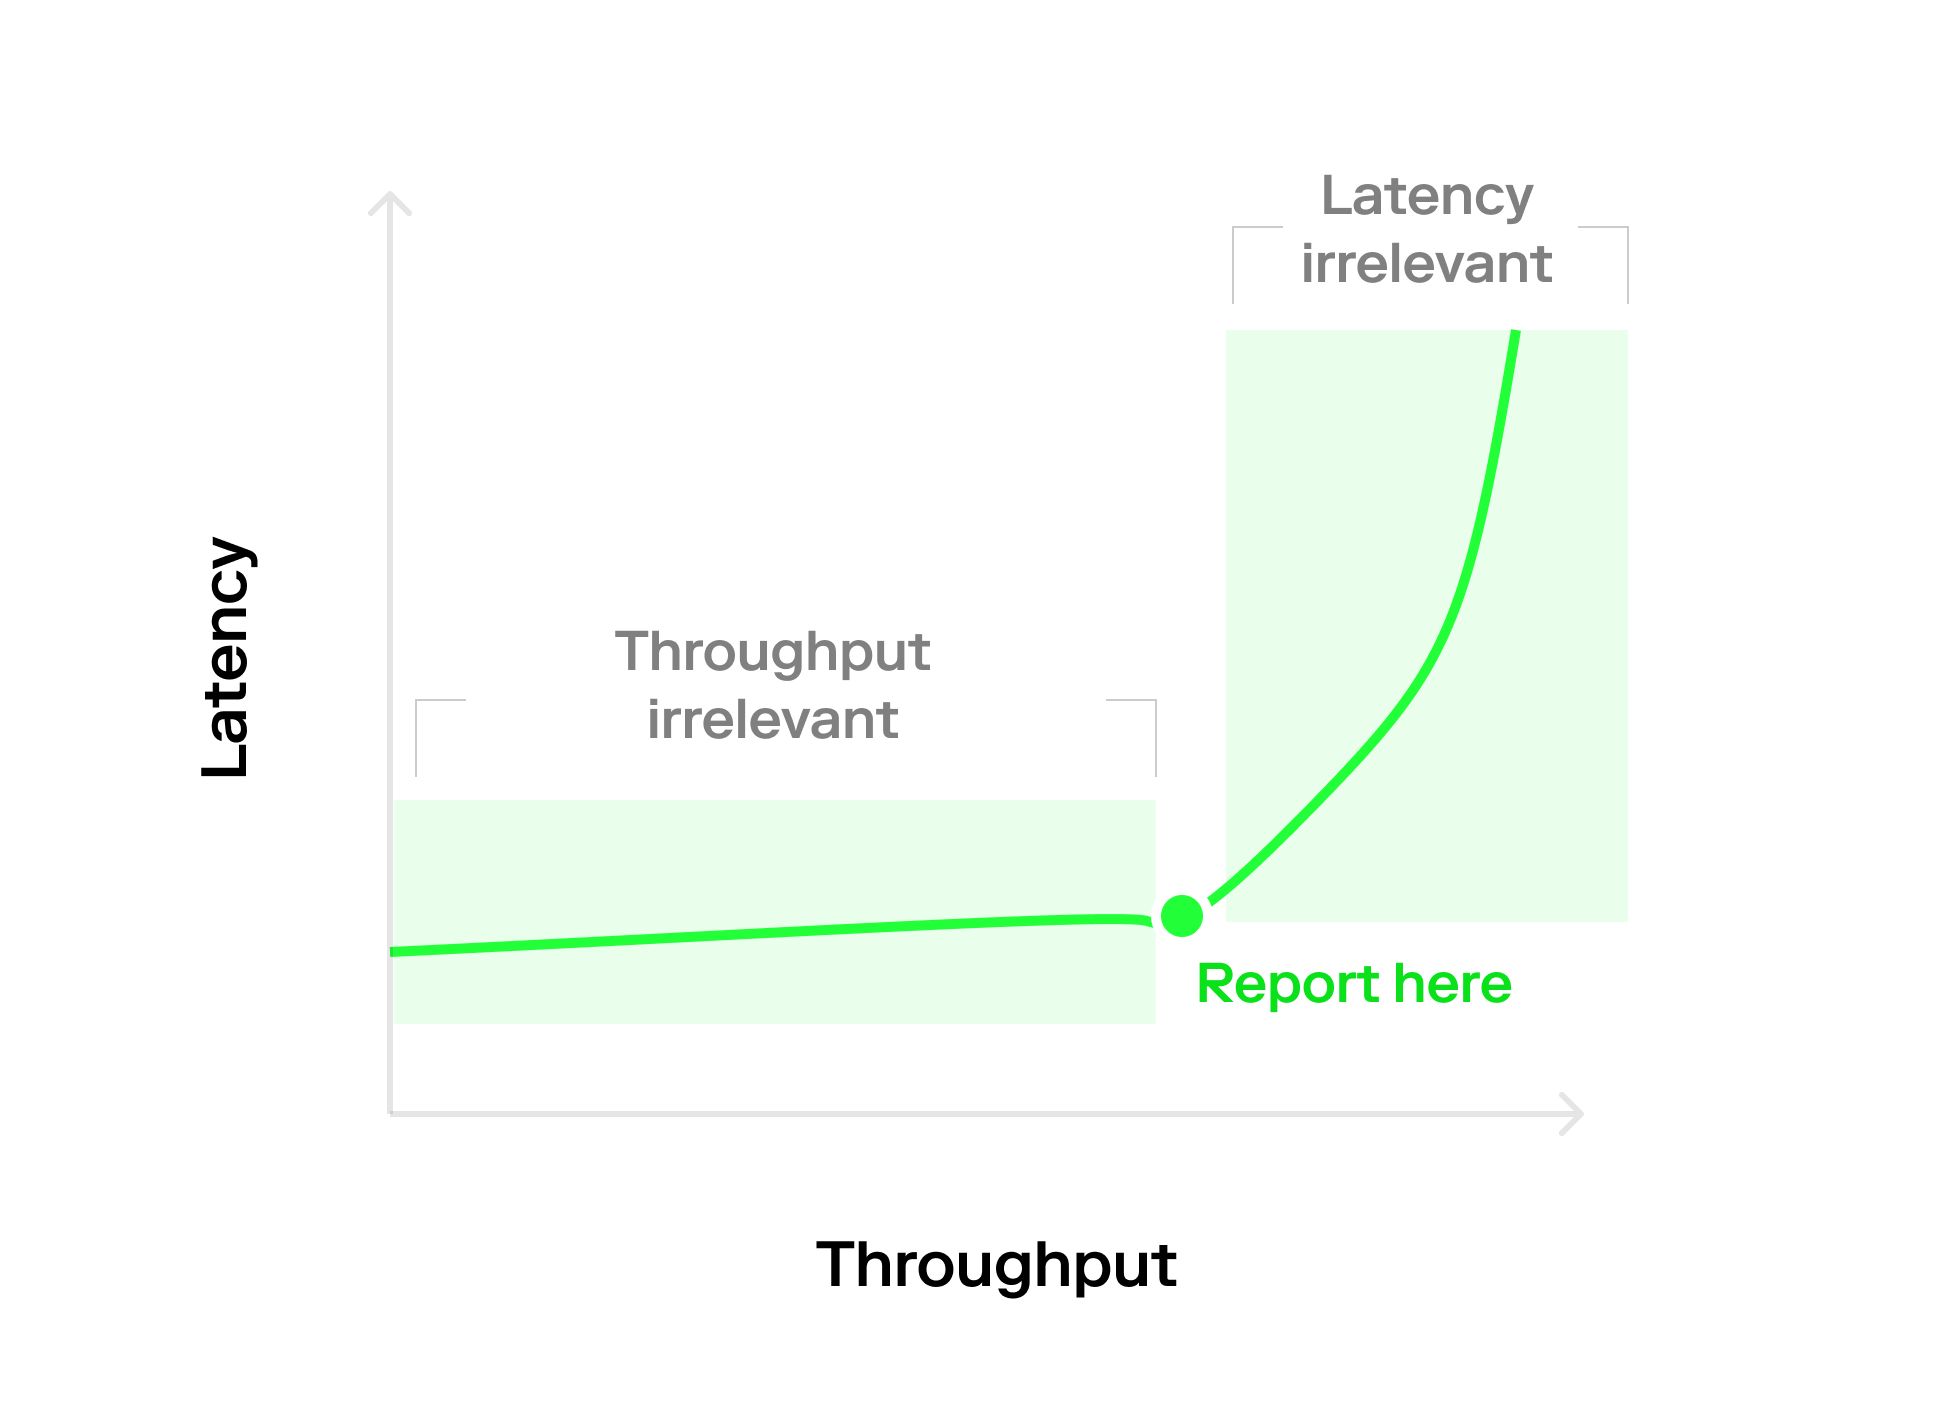
When there is little contention, latency is constant, and throughput can be varied simply by changing the load. This occurs because there is a fixed minimum cost to commit a transaction and the queue delay is zero at low contention, resulting in "whatever comes in, comes out directly."
At high contention, throughput is constant, but latency can vary simply by changing the load.
This is because the system is already overloaded, and adding more load causes the wait queues to grow indefinitely. Even more counterintuitively, the latency appears to vary with experiment length. This is an artifact of infinitely growing queues.
All of this is visible on the classic "hockey stick graph" or "L-graph," depending on the interarrival distribution (as discussed later). As a result, the key takeaway from this blog post is that we should measure in the hot zone, where both throughput and latency affect our benchmark, rather than at the edges, where only one or the other matters.

Measuring Methodology
When conducting an experiment, there are three main design options:
Open vs. closed loop
There are two primary methods for controlling the flow of requests to the target. An open-loop system is modeled by n = ∞ clients that send requests to the target according to a rate λ and an inter-arrival distribution, e.g., Poisson. A closed-loop system limits the number of outstanding requests at any given time. The distinction between an open and closed loop system is a characteristic of a particular deployment, and the same system can be deployed in different scenarios. For instance, a key-value store may serve thousands of application servers in an open loop deployment or just a few blocking clients in a closed loop deployment.
Testing for the correct scenario is essential because, in contrast to closed-loop systems, which typically have latencies constrained by the number of potential outstanding requests, open-loop systems can produce significant queuing and, as a result, longer latencies. Generally speaking, blockchain protocols can be used by any number of clients and are more accurately evaluated in an open-loop environment.
Interarrival distribution for synthetic benchmarks
A natural question to ask when creating a synthetic workload is how to submit requests. Many systems preload the transactions before the measurement begins, but this biases the measurements because the system starts at the unusual state of 0. Furthermore, preloaded requests are already in main memory and thus bypass the networking stack.
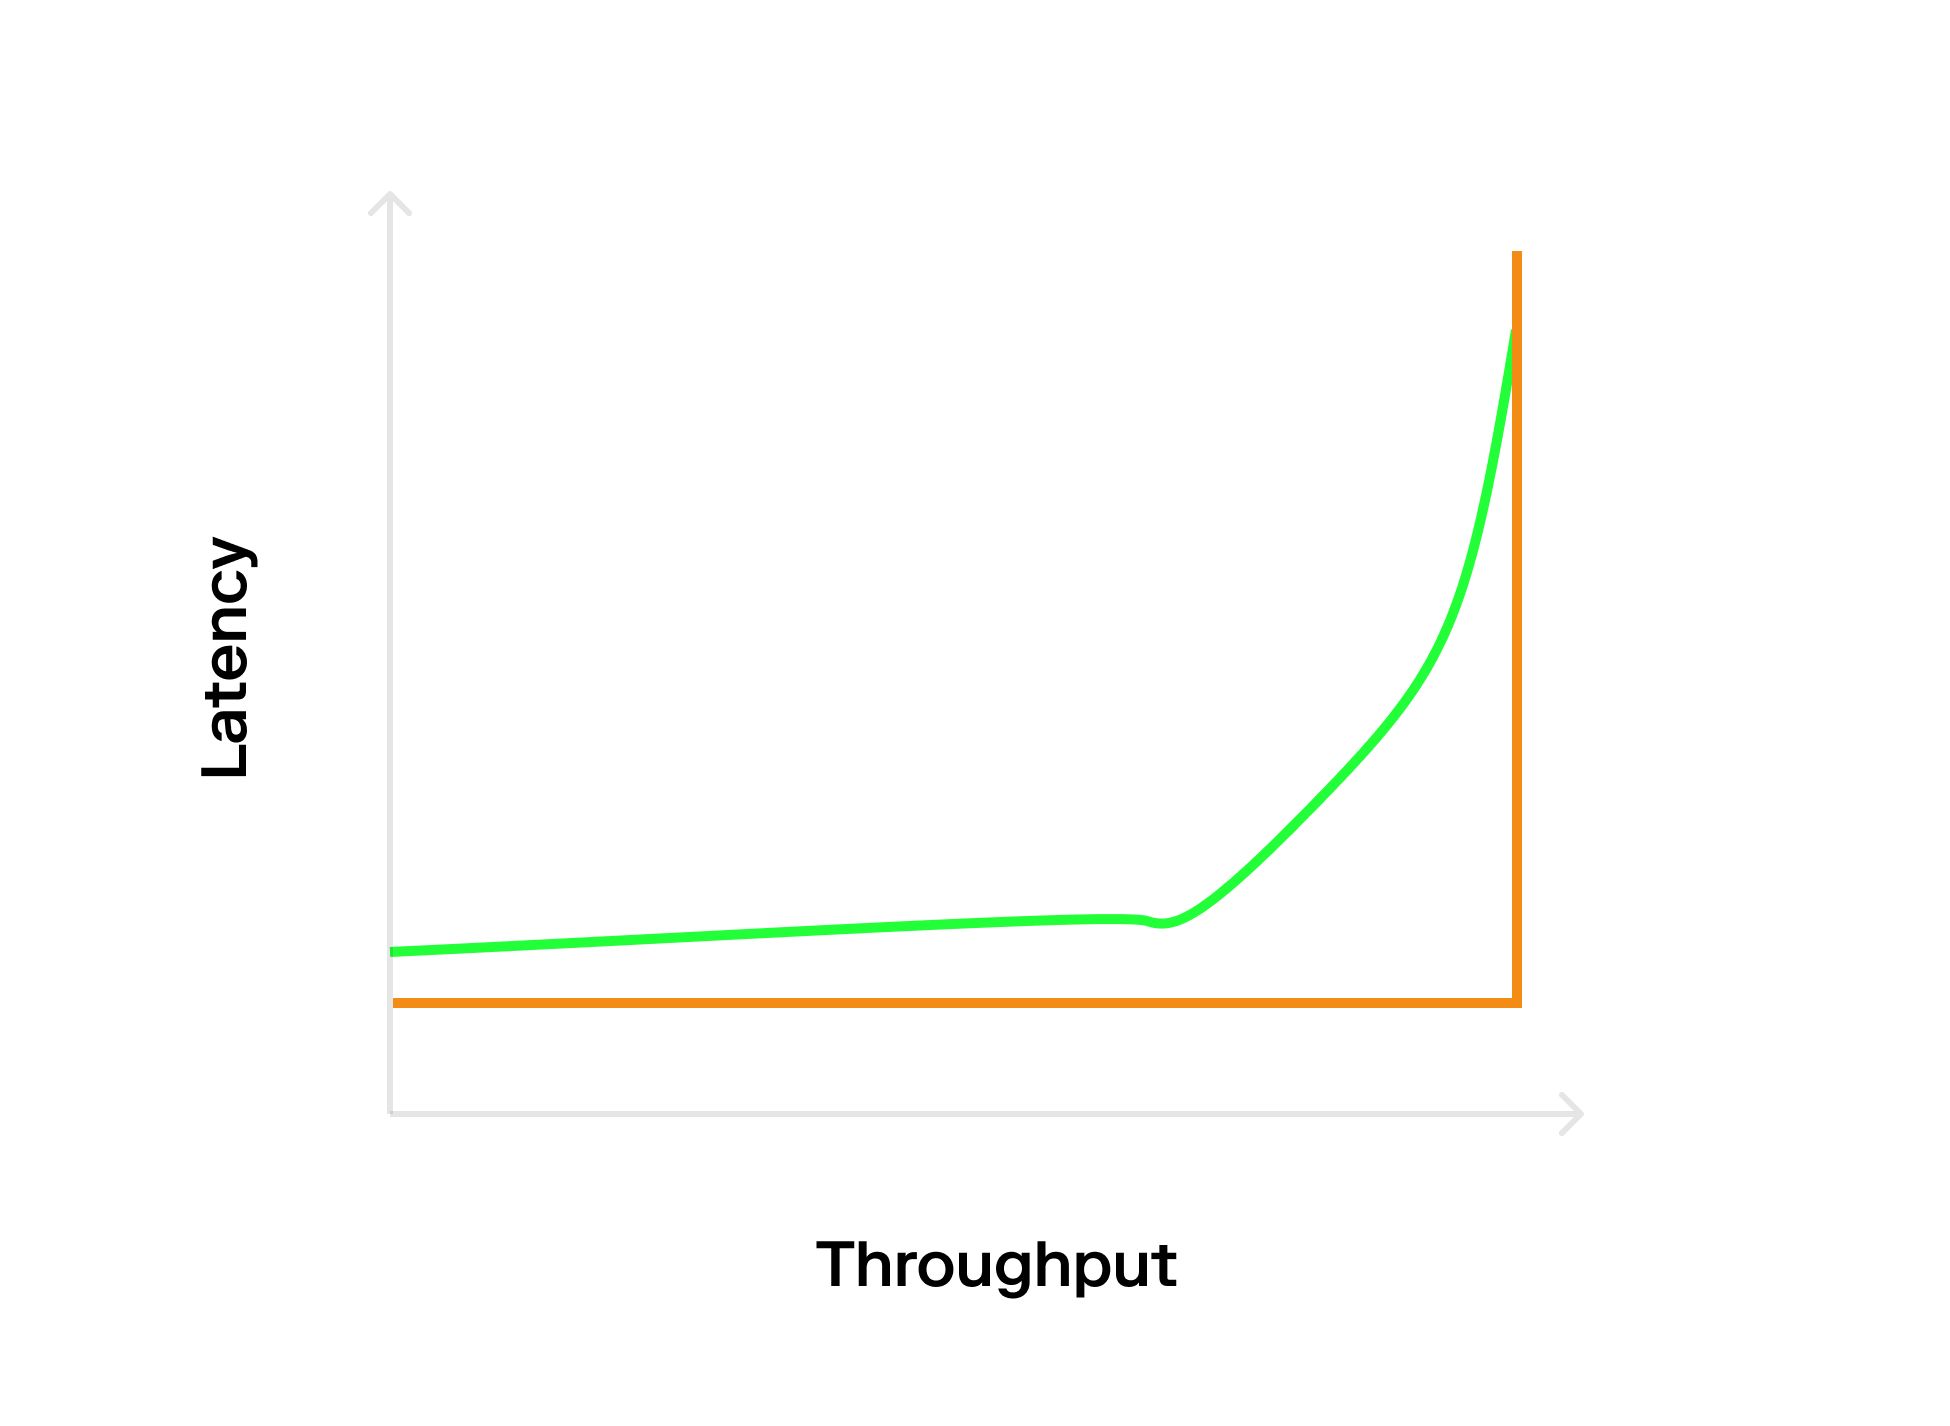
A slightly better approach would be to send requests at a deterministic rate (for example, 1000 TPS). This would lead to an L-shaped graph (orange) since there is optimal usage of the system’s capacity.

However, open systems frequently don't act in such a predictable way. They instead have periods of high and low load. To model this, we can employ a probabilistic interarrival distribution, which is typically based on the Poisson distribution. This will result in the "Hockey stick" graph (blue line) because the poisson bursts will cause some queuing delay (max capacity) even if the average rate is less than optimal. This is beneficial to us because we can see how the system handles high load and how quickly it recovers when the load returns to normal.
Warm-up Phase
A final point to consider is when to begin measuring. We want the pipeline to be full of transactions before we begin; otherwise, warm-up delays will be measured. This should ideally be accomplished by measuring latency during the warm-up phase until the measurements follow the expected distribution.
How to compare
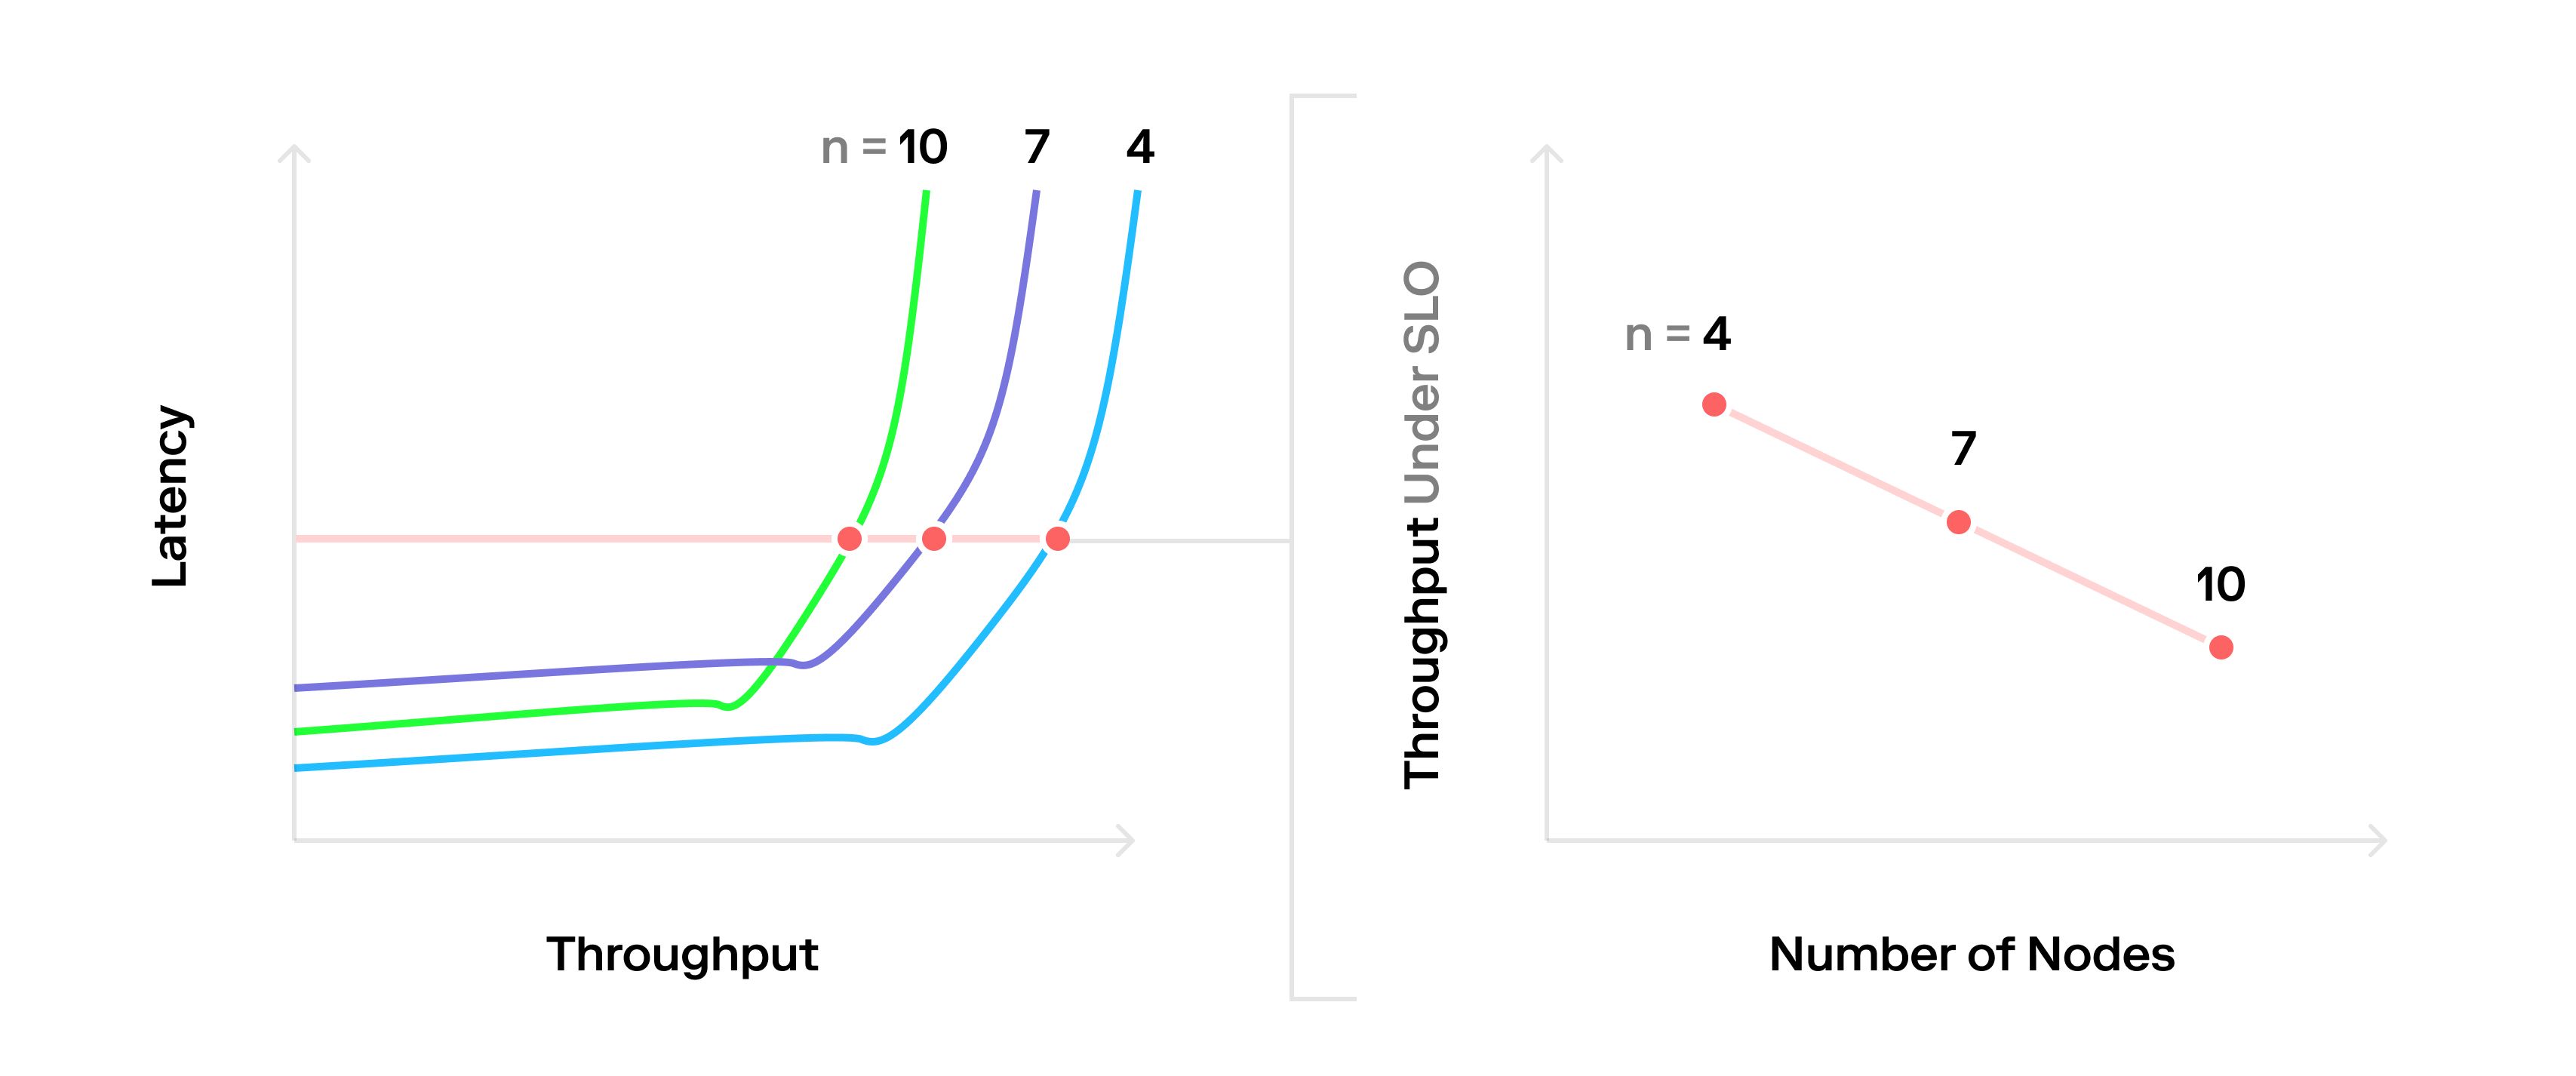
The final difficulty is comparing the system's various deployments on an apples-to-apples basis. Again, the difficulty is that latency and throughput are interdependent, so it may be difficult to produce a fair throughput/number of nodes chart. Instead of simply pushing each system to its maximum throughput (where latency is meaningless), the best approach is to define a Service Level Objective (SLO) and measure the throughput at this point. Drawing a horizontal line at the throughput/latency graph that intersects the Latency axis at the SLO and sampling the points there is a nice way to visualize this.

But I have set an SLO of 5 seconds and it only takes 2 seconds.
Someone might be tempted to increase the load here in order to take advantage of the marginally higher throughput available after the saturation point. But this is dangerous. If a system operation is underprovisioned, an unexpected burst of requests will cause the system to reach full saturation, resulting in an explosion of latency and a very rapid breach of the SLO. In essence, operating after the saturation point is an unstable equilibrium. As a result, there are two points to consider:
-
Overprovision your system. In essence, the system should operate under the saturation point so that bursts in the interarrival distribution are absorbed rather than lead to increased queueing delays.
-
If you have room under your SLO, increase the batch size. This will add load on the critical path of the system instead of the queuing delay and get you the higher throughput for higher latency tradeoff you are looking for.
I am generating an enormous load. How can I measure latency?
When the load is high, trying to access the local clock and add a timestamp to every transaction that arrives on the system can lead to skewed results. Instead, there are two more viable options. The first and simplest method is to sample transactions; for example, there may be a magic number in some transactions that are the only ones for which the client keeps a timer. After commit time, anyone can inspect the blockchain to determine when these transactions were committed and thus compute their latency. The main advantage of this practice is that it does not interfere with interarrival distribution. However, it may be considered "hacky" because some transactions must be modified.
A more systematic approach would be to have two load generators. The first is the main load generator, which follows the Poisson distribution. The second request generator measures latency and has a much lower load; think of it as a single client in comparison to the rest of the system. Even if the system sends back replies to each and every request (as some systems do, such as a KV-store), we can easily drop all replies to the load generator and only measure the latency from the request generator. The only tricky part is that the actual interarrival distribution is the sum of the two random variables; however, the sum of two Poisson distributions is still a Poisson distribution, so the math isn't that difficult:).
Conclusions
Measuring a large-scale distributed system is crucial for recognizing bottlenecks and profiling expected behaviour under stress. We hope that by using the above methods, we can all take the first step toward a common language, which will eventually lead to blockchain systems that are better suited for the work they do and the promises they make to end users.
In future work we plan to apply this methodology to existing consensus systems, if that's something of interest, please reach out on Twitter!.
Acknowledgments: All these are lessons learned with my co-authors during the design and implementation of [Narwhal & Tusk](https://arxiv.org/abs/2105.11827) (Best Paper Award @ Eurosys 2022) as well as comments on earlier drafts by Marios Kogias, Joachim Neu, Georgios Konstantopoulos, and Dan Robinson.
Disclaimer: This post is for general information purposes only. It does not constitute investment advice or a recommendation or solicitation to buy or sell any investment and should not be used in the evaluation of the merits of making any investment decision. It should not be relied upon for accounting, legal or tax advice or investment recommendations. This post reflects the current opinions of the authors and is not made on behalf of Paradigm or its affiliates and does not necessarily reflect the opinions of Paradigm, its affiliates or individuals associated with Paradigm. The opinions reflected herein are subject to change without being updated.